Tuesday, May 27, 2025

Module 2 - Python Fundamentals

During the second week of the GIS programming module, specifically in Exercise 2, we focused on the foundational elements of the Python programming language. This included working with various data types such as numbers, strings, variables, and lists. We explored the use of functions, methods, and modules, and learned how to save our code as scripts. Additionally, we practiced writing conditional statements and employing loop structures.

Furthermore, we gained practical experience in executing a geoprocessing tool from the notebook that interacts with a layer in ArcGIS Pro. We also learned the process of incorporating existing code into the ArcGIS Pro Notebook by copying and pasting the code into a notebook cell.

This week’s lab assignment comprises four distinct steps.

In the first step, the task involves assigning my full name as a string to a variable. Subsequently, the full name should be split into individual components, resulting in a list of names. Finally, indexing techniques will be employed to extract and print my last name.

The second step involves working with a prewritten code that generates a list of players participating in the dice game. Upon importing the random module and executing the code, I encountered an initial error TypeError: can only concatenate str (not "int") to str. To fix this error I added str to word (dice). After rectifying this issue and running the code again, I identified a second error, which required changing a capital 'X' to a lowercase 'x'. After addressing these errors, the code executed successfully.

In the third step, a loop must be created to generate and add 20 random numbers, each ranging from zero to ten, into a list. Finally, the fourth step requires the implementation of a loop designed to remove a specified integer from the previously generated list and print the updated list. 


Results from running the code:


In conclusion, completing the Lab for module 2 proved to be quite challenging, utilizing IDLE to compile the code in a separate script window was more efficient compared to ArcGIS Notebook and its cell functionality

Monday, May 19, 2025

Module 1 - Python Environments & Flowcharts

During the first week of GIS programming, we focused on executing Python scripts and engaging with the Python interpreter IDLE as well as Python (Jupyter) ArcGIS Notebook. Additionally, we examined flowcharts and developed our ability to think algorithmically through their use. 

Python is recognized as a simple yet powerful programming language. It is notably easier to learn compared to other programming languages, such as C++. Furthermore, it is free and open-source software. A key distinction of Python in relation to other programming languages is that it is an interpreted language. Unlike compiled languages, which necessitate a compiler to convert source code into machine code for execution, Python processes code sequentially, executing it line by line without the need for a compiler. This method of direct execution promotes a more straightforward approach to both code development and debugging. 

We were also introduced to various script editors and IDEs (Integrated Development Environments) that are utilized for writing and executing scripts. The three primary IDEs we explored for coding and testing purposes are IDLE (Integrated Development and Learning Environment), PyCharm, and Spyder. 

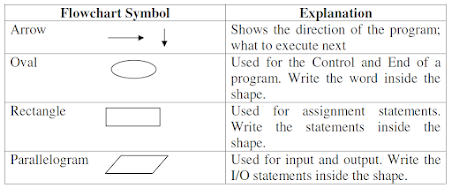
The second part of the module concentrated on flowcharts and their significance in programming, as they assist in visually and logically organizing a program. Flowcharts employ predefined symbols, such as ovals, rectangles, and parallelograms, to create a visual representation of the program. Arrows are utilized to indicate the direction of the program flow and the sequence of execution.

Agarwal_et_al_2010_Chapter 3 Page10

Utilizing our understanding of algorithmic thinking through flowcharts, we developed a flowchart to represent a Python script that converts 3 radians into degrees using the formula: Degrees = Radians * 180/Pi where Pi = 22/7 


Finally, this week, we were assigned to read "The Zen of Python" poem and to compose a paragraph reflecting our interpretation of its meaning.

“Zen of Python”, by Tim Peters, delves into the constitution of a well-established lines of code. In the poem, Tim remarks that a code must be well-structured or “beautiful”, as well as it directly and explicitly states what it does. A well-made code is simple; but if it were to be complex, it should not be made difficult. Tim remarks that a flat code, rather than nested, is better as it would be easily understood and more easily maintained. Furthermore, making a code neat and unscattered produces easy readability to its viewer.

According to the poet, even though there may be special cases, these special cases should never warrant a need to break the abovementioned rules. The poet goes on to say as well that although a practical code, as in one that works, may have a few errors, for instance, is better than a pure, mistake-free code, errors must never be left unlooked and remain unresolved. Furthermore, these errors must be found and fixed as soon as possible. Thus, a coder must always look for and research the best approach to building lines of code and refuse the urge to guess their work. The poet refers to Dutch programmer Guido van Rossum, the author of Python, stating that there is always one obvious approach to doing something.

Tim Peters closes off his poem remarking that fixing a code is better done progressively, rather than immediately, as the rush to do something may be worse than not doing it at all. And only when the implementation of a code is easy to explain is when such code is considered a good idea. Peters concludes with a reference to namespaces, or the system that ensures all names in a program are unique and can be used without ambiguity, referring to the uniqueness of all coders, and urging them to go out and create their codes.


Thursday, May 1, 2025

Module 7 - Neocartography, 3D Mapping and Google Earth

Lecture material for the final module in cartography covered several aspects from Neocartography and VGI (Volunteered geographic information) to 3D and Google Earth mapping. We explored the growth of volunteerism in gathering geographic information, mainly due to citizens mapping their communities. This has led to Volunteered Geographic Information. Technologies like Wikimapia and OpenStreetMap enable users to contribute to maps, but this can also create accuracy challenges. Many platforms require users to build credibility, and AI can help find false information.

In the 3D videos, we explored the integration of 2D and 3D visualizations within ArcGIS Pro, as well as the application of Lidar (Light Detection and Ranging) technology for enhanced 3D visualization. Lidar is a remote sensing technique that gathers data via aircraft equipped with laser technology, which emits laser light to measure distances and collect various data points for analytical purposes. Furthermore, we identified the method for producing animated videos in Google Earth Pro, which allows us to efficiently communicate our findings to audiences who may lack access to GIS applications.


During this week's lab session, we developed a population dot density map and a tour map utilizing ArcGIS Pro and Google Earth Pro. A significant advantage of employing Google Earth Pro for mapping purposes is its availability as a free download, making it accessible to individuals without a background in Geographic Information Systems (GIS). Furthermore, geographic data can be saved and shared in the form of KML (Keyhole Markup Language) files or KMZ files, which are compressed versions of KML. These formats are specifically designed for displaying geographic information in applications like Google Earth.

Initially, we incorporated the surface water layer into ArcGIS Pro and applied the appropriate symbology, ensuring it matched the legend provided in the accompanying JPEG file. Utilizing "Layer to KML" tool in ArcGIS pro to convert the layer into a KML file format. Double clicking on the new file will open it in Google Earth Pro. Following this, we added the legend along with two additional layers: one for counties border and another for the dot density layer. To ensure the dot density layer displayed prominently, we adjusted its settings in the altitude tab under layer properties. Consequently, we created a new folder within My Places and transferred the layers from the temporary places folder into this newly established folder, and saved the layers as a KMZ file.

The subsequent task involves creating a Google Earth tour that highlights the entirety of South Florida, including Miami metropolitan area, Downtown Miami, Downtown Fort Lauderdale, Tampa Bay area, St. Petersburg, Downtown Tampa, and culminating back at the full map of South Florida. To achieve this, we generated a placemark for each designated location by utilizing the Add Placemark button on the toolbar. Finally, we recorded the tour using the "Record a Tour" button, saved it, and organized it alongside the other map layers, ultimately saving the locations as a KMZ file for the tour.

Creating a seamless tour in Google Earth presented significant challenges due to its limitations. After numerous attempts, I successfully recorded a tour that meets my expectations. One key lesson learned in crafting a smooth tour in Google Earth is the importance of establishing multiple placemarks for the city. This approach facilitates a fluid transition between placemarks, resulting in a more cohesive and continuous movement throughout the tour.