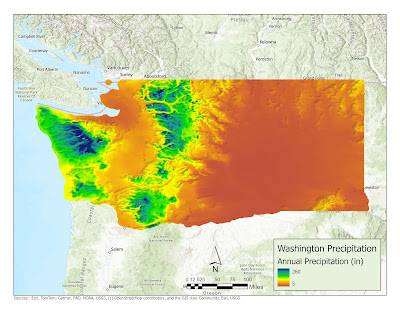
The objective
for this week is to create two isarithmic maps utilizing precipitation data for
the State of Washington; a continuous tone map and a hypsometric tints map. The
data utilized for this exercise has been prepared using the PRISM
(Parameter-elevation Relationships on Independent Slopes Model) methodology.
The raster
data representing annual precipitation (measured in inches) utilized in this
map was sourced from the USDA Geospatial Gateway website. Data gathered from
climate monitoring stations is transformed into grid points through various
methodologies. Although these methodologies exhibit precision in flat terrain,
they encounter increased complexity in mountainous areas. The
Parameter-elevation Regressions on Independent Slopes Model (PRISM) has proven
effective in modeling precipitation in sloped terrains. This technique combines
point data with an elevation grid, such as Digital Elevation Models (DEM), to
generate estimates of monthly, annual precipitation, and temperature.
The initial
map developed utilized continuous tone symbology. This representation method
employs a gradient of colors that transition smoothly, rather than relying on
distinct symbols or categories. In this approach, the colors on the map
progress gradually from red to yellow, then to green, and ultimately to blue,
creating a cohesive visual surface. The implementation of continuous tone
symbology in these maps significantly improves the perception of continuity and
fluidity in the presented data. Additionally, a hillshade effect was
incorporated to further enhance the visual impact.
In the second map, we created a
layout utilizing hypsometric tints, a hillshade effect, and contour lines. An
isarithmic map featuring hypsometric tints employs contour lines and distinct
colors to represent varying elevation levels. We employed ArcGIS Pro to convert
the raster cell values into integers, facilitating the creation of hypsometric tints.
Additionally, we utilized ArcGIS Pro to generate two new layers, a hillshade
layer and a contour layer because elevation data is incorporated into the
dataset. The hillshade layer was generated by utilizing the "Create
Surface" function located within the Raster Analysis tab, while the
contour layer was produced using the "Contour List" tool.
I found
this week's laboratory session to be highly enjoyable. Upon completing the
project, I took the initiative to download the PRISM data set for the year 2024
from https://prism.oregonstate.edu. I subsequently analyzed the yearly
precipitation data for the continental United States, which further enriched my
understanding of the creation and analysis of isarithmic maps.


No comments:
Post a Comment